Introducing the New Iris Investigate

Today DomainTools is excited to release a new version of Iris Investigate, our flagship infrastructure investigation product. We are introducing new ways for you to identify malicious behavior and manage investigations of domains. We also streamlined the user interface, so it’s easier to use while also providing flexibility so you can prioritize the data that matters most to you.

A New Look and Feel
The first thing you’ll notice when logging into the new Iris Investigate is a modernized look and feel. Based on customer feedback, we also updated how data is organized in the application. The various data panels will still look familiar, but there are some helpful changes that will make them even easier to work with.
There are two important ways you can customize the panels to help you see what matters most to you. First, you can change the order of panels by simply dragging and dropping the panels that are most important to be closest to the Pivot Engine. Second, you can change the width of each panel – either small, medium or large. This helps you prioritize which panels get the most screen real estate. If you have a wide monitor, you can have quite a few panels stretching from left to right.
New Features to Find Badness
We added new data capabilities to help users find and manage malicious domains.
First, we improved the gathering and accuracy of our web content data. We are now capturing and indexing two new fields:
- Website Title: The HTML title is now displayed in Pivot Engine and guided pivots can help you find other domains with the same title. The Website Title can also be searched via Advance Search so you can find domains with pages that reference brands or terms you care about.
- Server Type: The server type seen when gathering a screenshot is saved and indexed. This too can have guided pivots and can be queried in Advanced Search. The Server Type can be a good data connector to help you identify hosting patterns in campaigns you might be monitoring.
Also—you can trigger web content updates by queueing a domain for a new screenshot!
We’ve also added a new data attribute, Lifecycle First Seen – shortened to just First Seen in Pivot Engine. This is the date and time when DomainTools identifies a domain as newly active. Prior to this update, the Whois Create Date was the way to identify the age of a domain. However, many TLDs do not provide Whois records, making it difficult to quickly judge the age of all domains. Now you can easily see the age of domains from all TLDs.
We made it easier to identify newly active domains within the context of larger searches you might be running: a new Advanced Search operator lets you search for domains with a First Seen within a specific time – for instance within the last day. This greatly speeds the process of zeroing in on just newly active domains that match the search and ignoring the older ones. The operator can also be used with the Whois Create Date to provide more flexibility on searching that attribute.
These new fields have been added to the Iris Investigate and Enrich APIs. The First Seen can be especially useful as a query parameter with the Iris Investigate API. Often, the Investigate API is used in “search mode” where multiple attributes are provided instead of just a single domain, similar to saved searches in the Investigate Web UI. The First Seen can be queried for a specific date time (UTC format) so an integration can effectively ask for newly active domains since the last query was made. This effectively creates a new monitoring functionality within the Iris Investigate API.
IP Inspect displays enrichment data for an IP address in a pop-up window from almost anywhere an IP address appears across Iris Investigate. You can see details for an IP – the location, ASN, Whois data, DNS PTR and more – without clicking across tabs or losing your place in the application.
Visualize Better Threat Intel
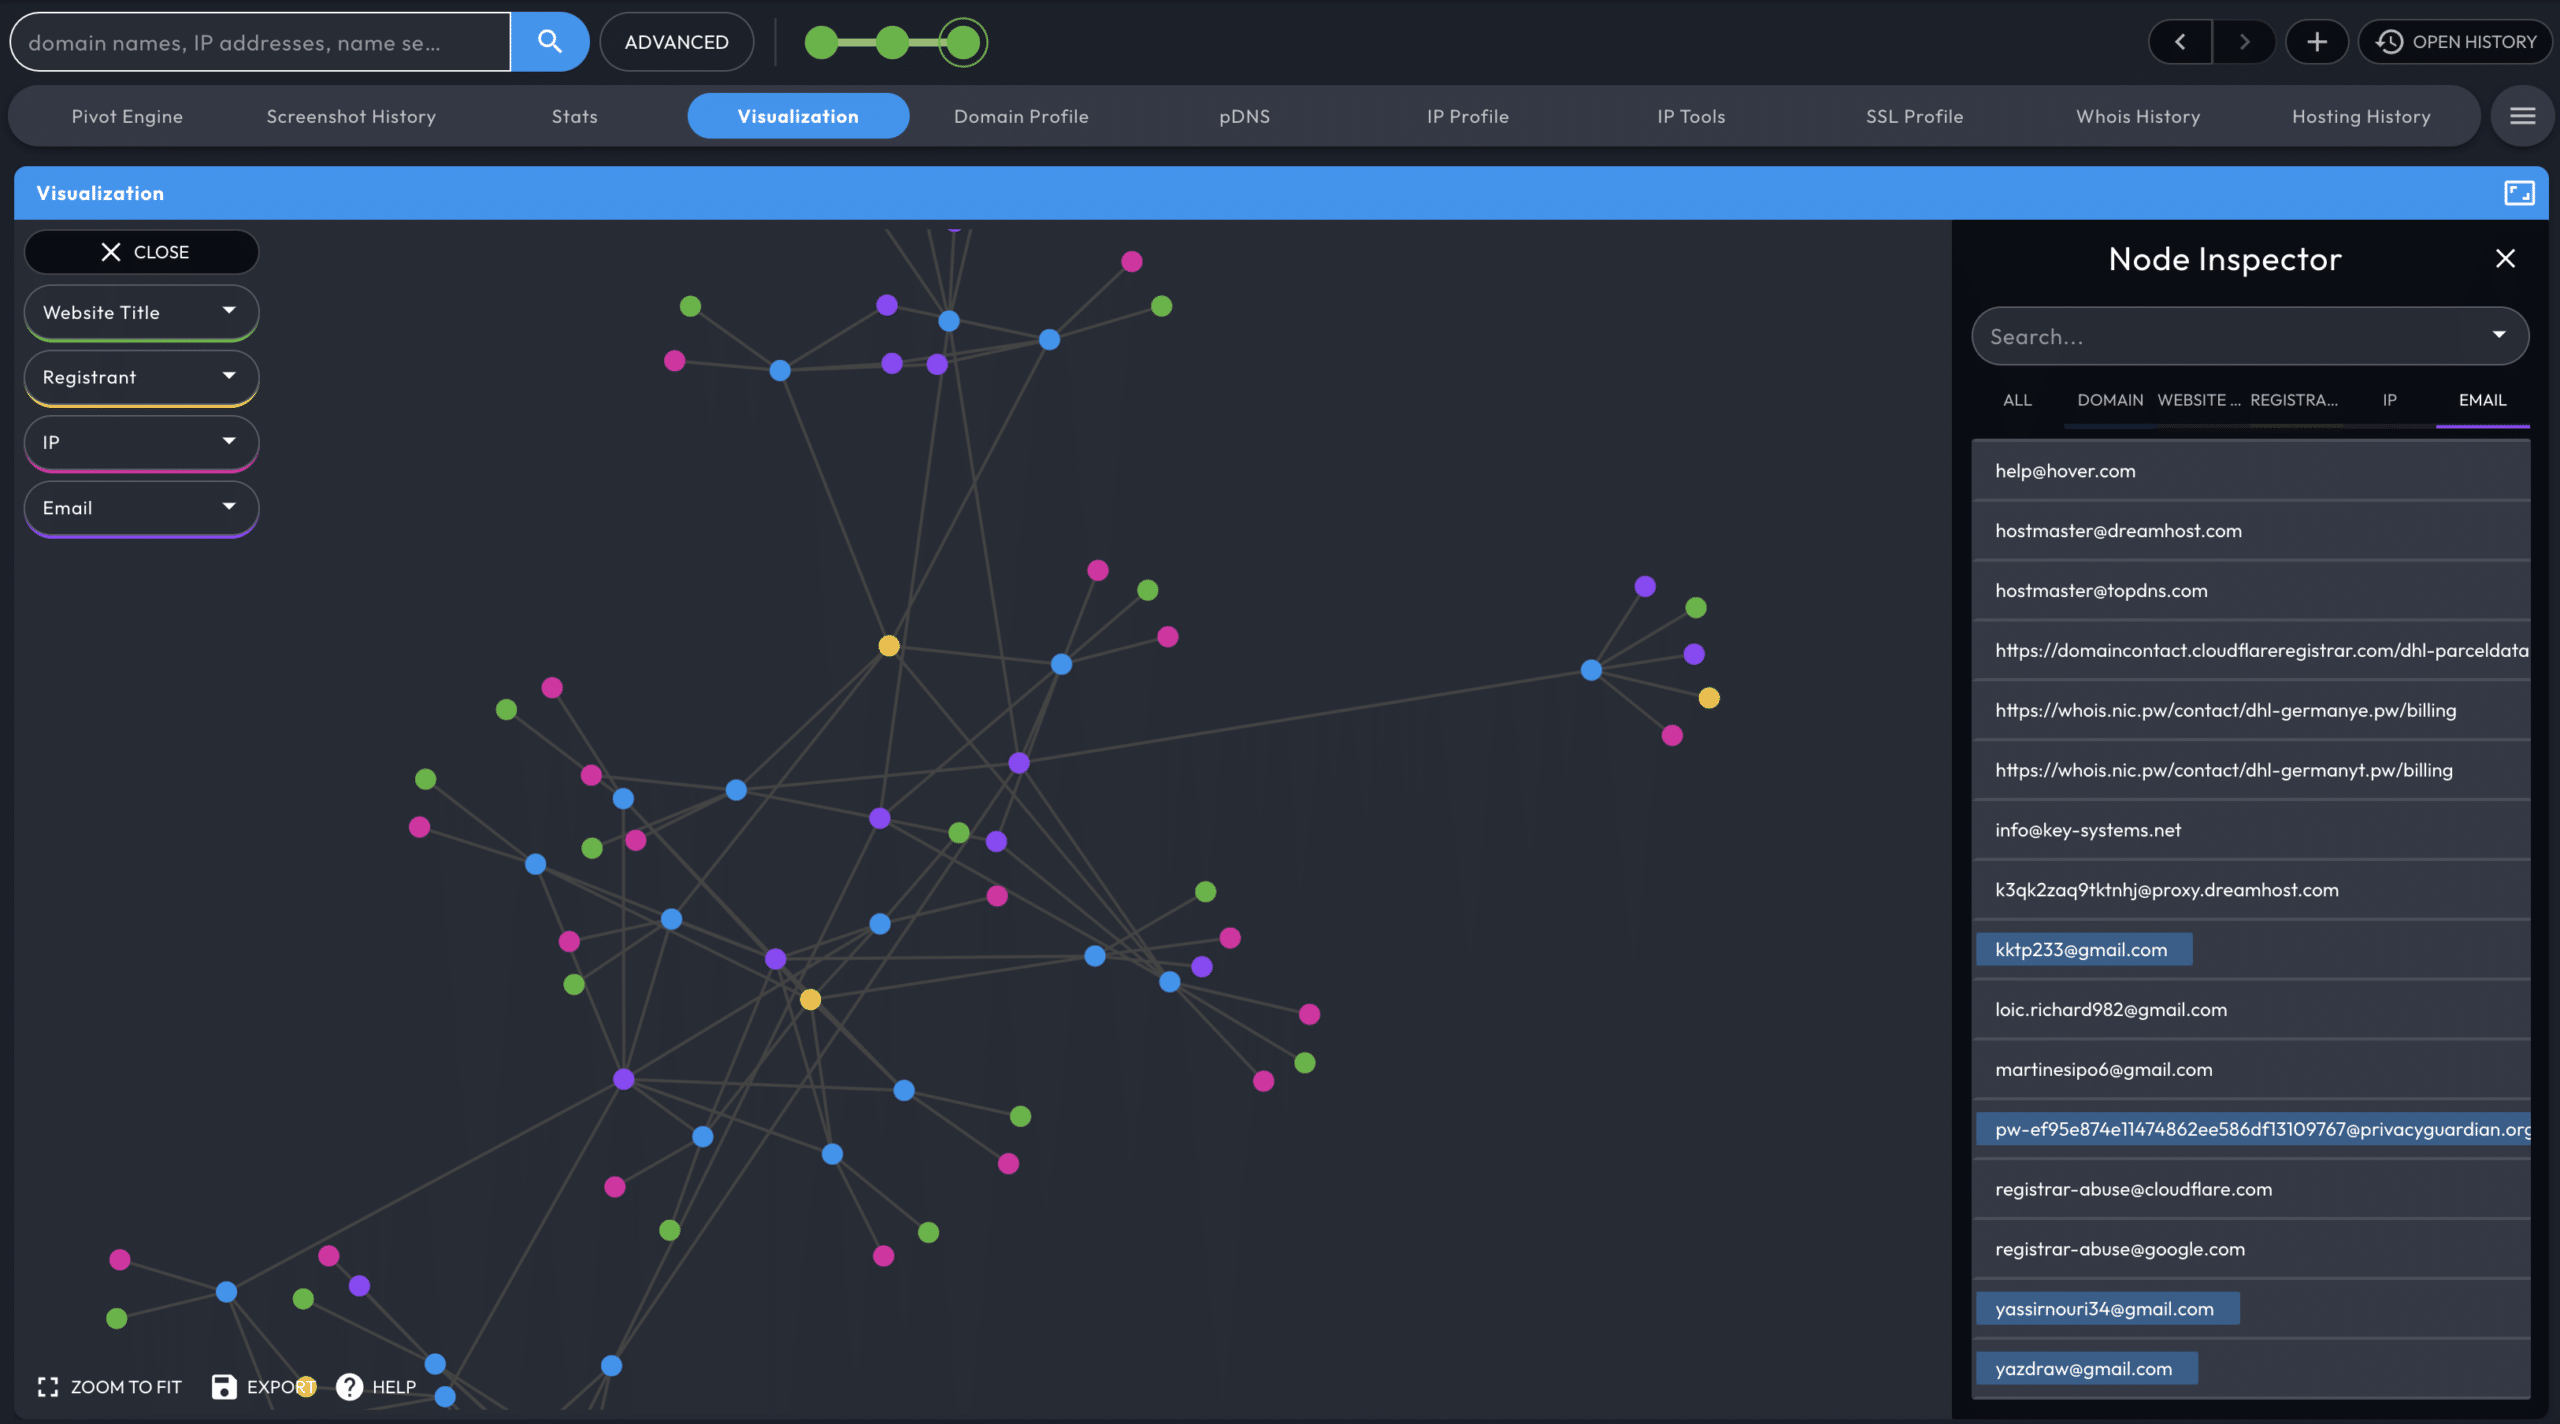
The Visualization module has also been significantly modernized. Interacting with data is easier, faster, and more vibrant. A new “Node Inspector” helps you see the specific values displayed in the visualization and locate specific points of interest. You can also filter the visible nodes by the number of connections, which can be particularly useful when working with large data sets. You can filter out domains with a small number of connections as those might not be part of a larger pattern you are tracking. You can also filter out domains with large numbers of connections. This can be useful if you are trying to focus on domains that use dedicated infrastructure and you don’t want to see connections to hosted infrastructure used by a large number of domains.
Summing Up
The new Iris Investigate is more than an aesthetic upgrade. We hope you’ll agree that the new fields and updated user experience makes your investigations faster, more effective, and more enjoyable. Please drop us a line at [email protected] and let us know what you think! And if you don’t have access to Iris Investigate but are interested, please contact us.


